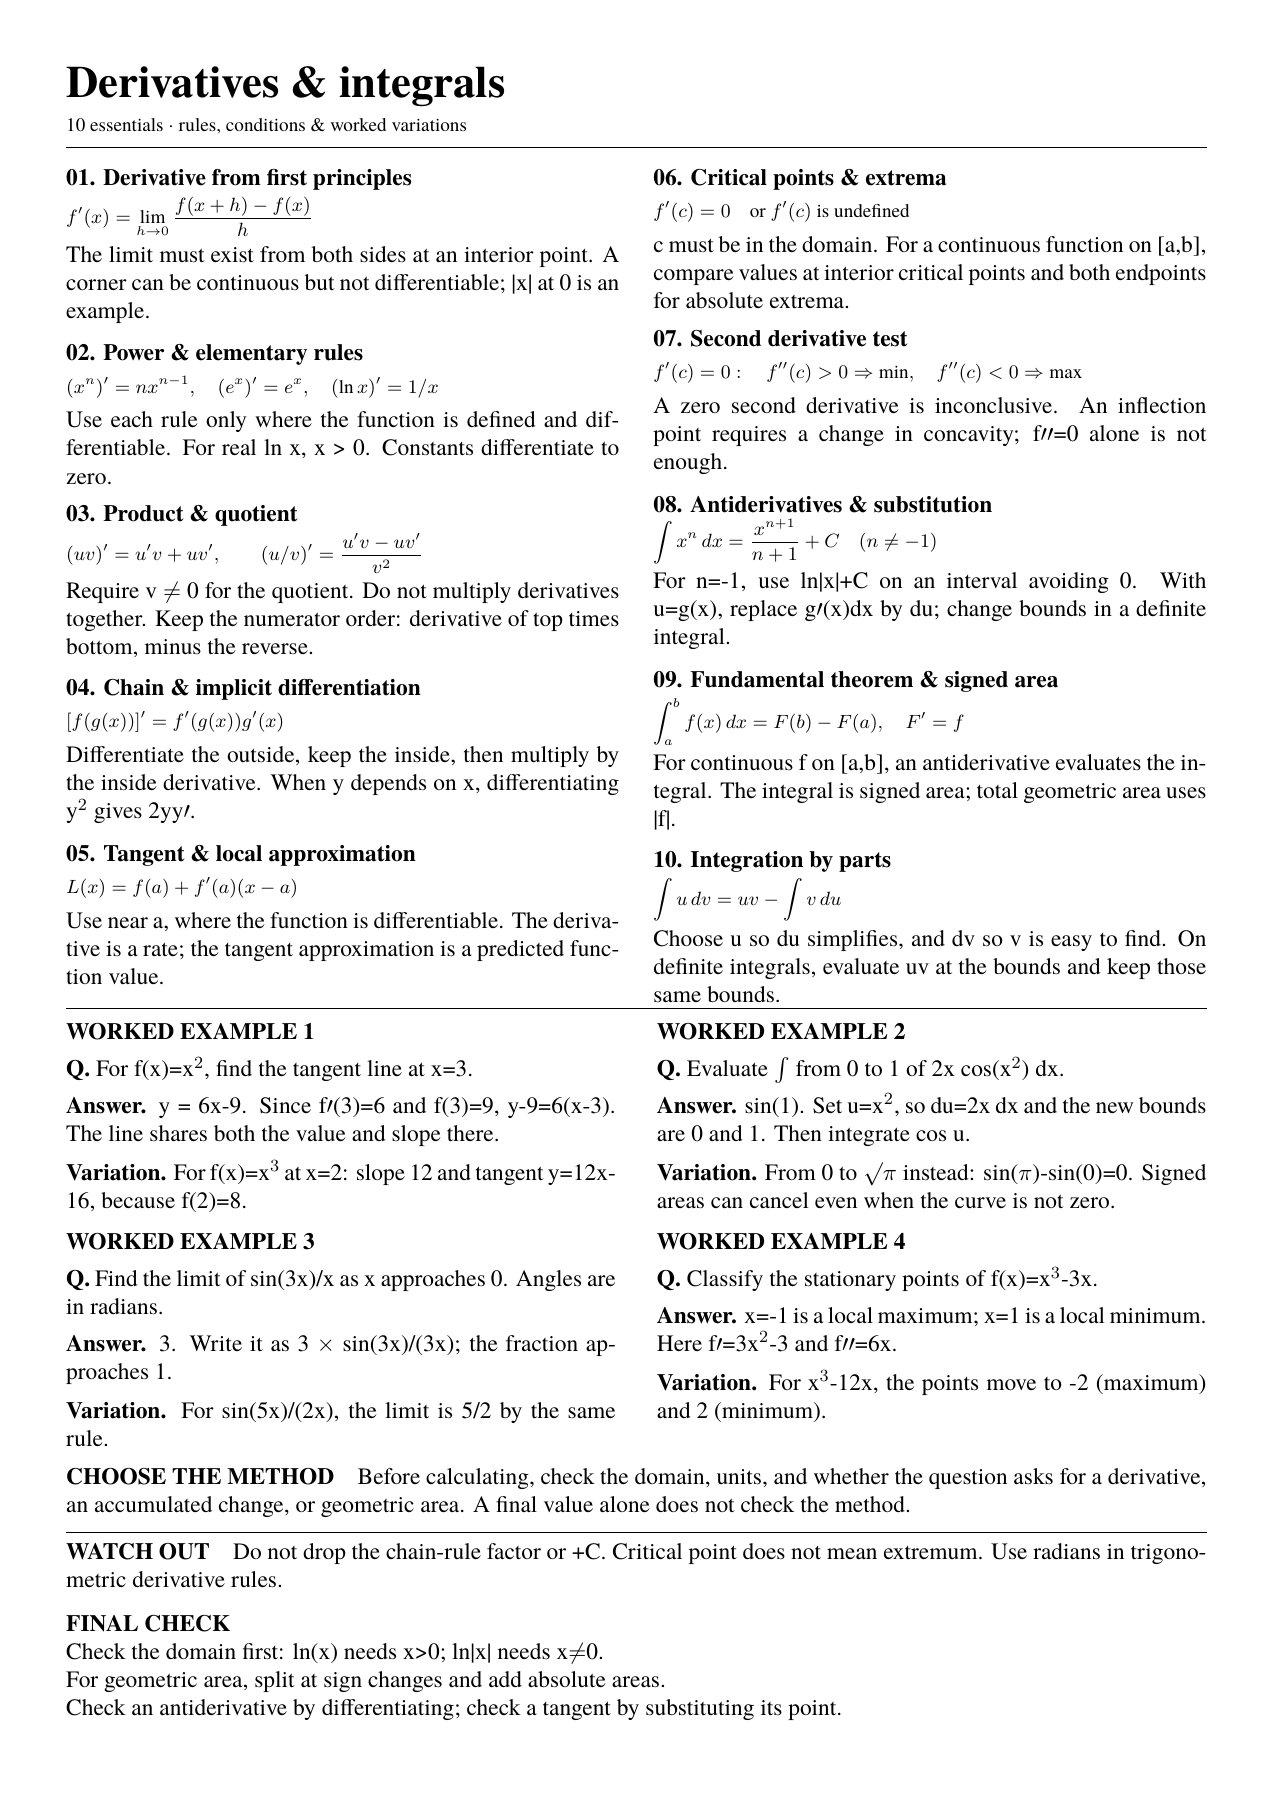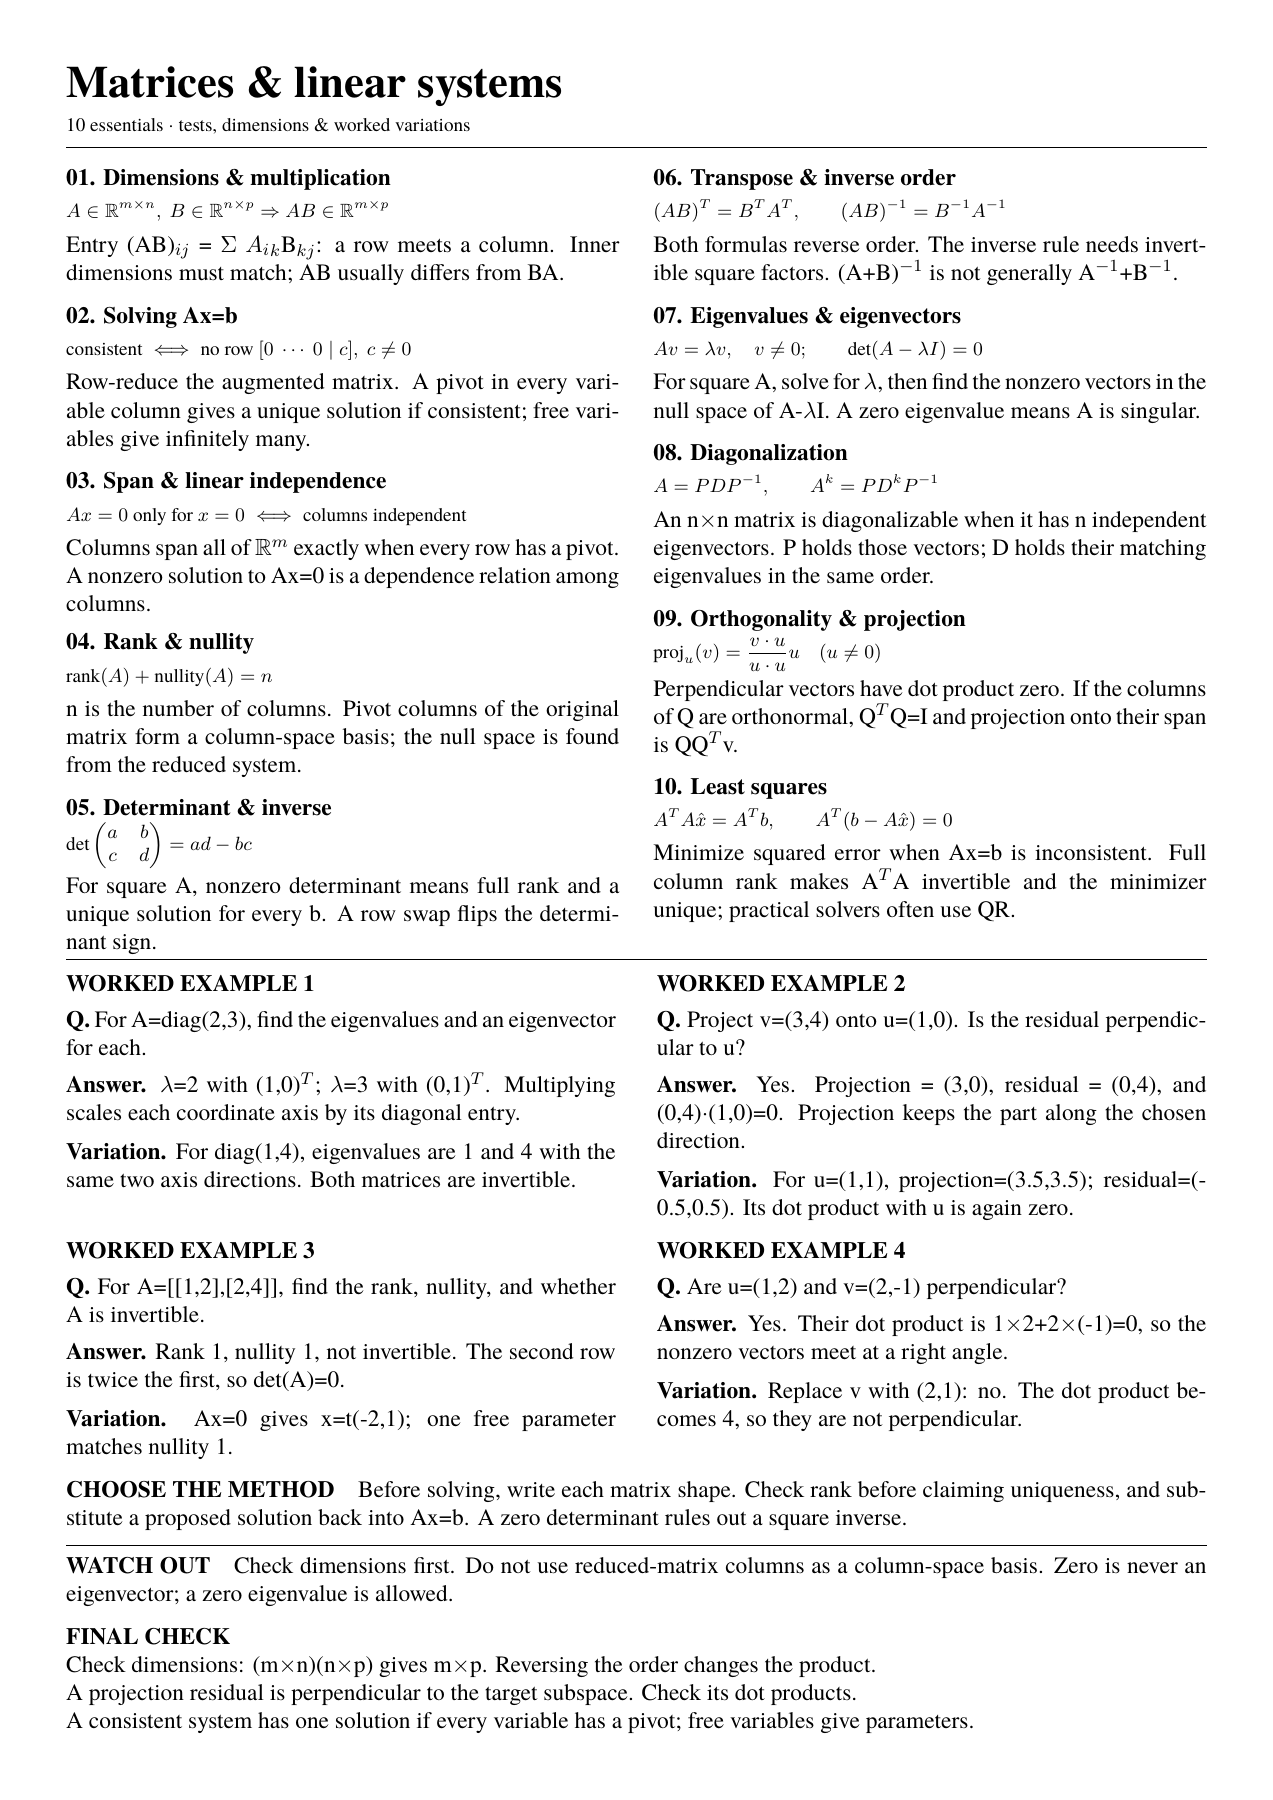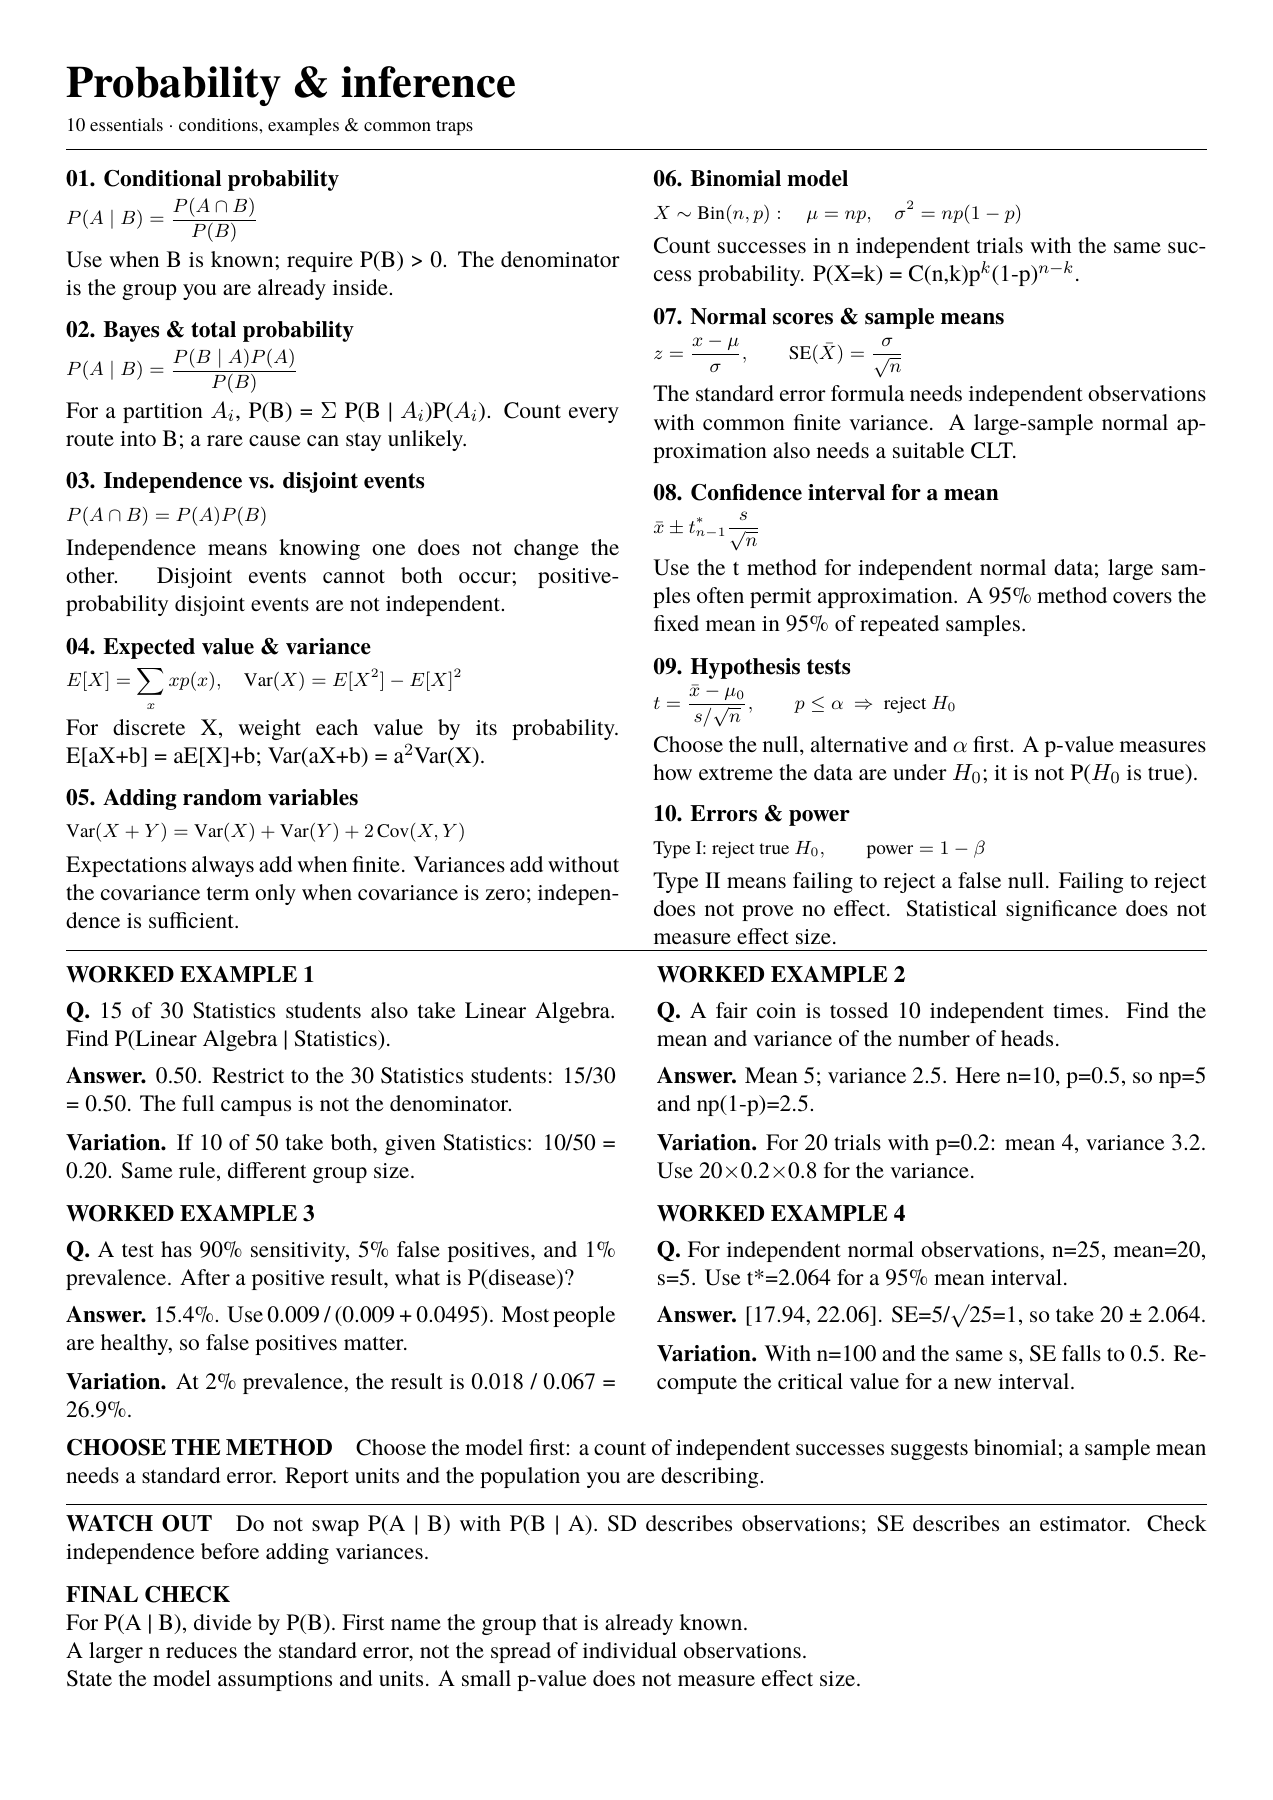
Probability & inference10 essentials · conditions, examples & common traps
01Conditional probability
Use when B is known; require P(B) > 0. The denominator is the group you are already inside.
02Bayes & total probability
For a partition Aᵢ, P(B) = Σ P(B | Aᵢ)P(Aᵢ). Count every route into B; a rare cause can stay unlikely.
03Independence vs. disjoint events
Independence means knowing one does not change the other. Disjoint events cannot both occur; positive-probability disjoint events are not independent.
04Expected value & variance
For discrete X, weight each value by its probability. E[aX+b] = aE[X]+b; Var(aX+b) = a²Var(X).
05Adding random variables
Expectations always add when finite. Variances add without the covariance term only when covariance is zero; independence is sufficient.
06Binomial model
Count successes in n independent trials with the same success probability. P(X=k) = C(n,k)pᵏ(1−p)ⁿ⁻ᵏ.
07Normal scores & sample means
The standard error formula needs independent observations with common finite variance. A large-sample normal approximation also needs a suitable CLT.
08Confidence interval for a mean
Use the t method for independent normal data; large samples often permit approximation. A 95% method covers the fixed mean in 95% of repeated samples.
09Hypothesis tests
Choose the null, alternative and α first. A p-value measures how extreme the data are under H₀; it is not P(H₀ is true).
10Errors & power
Type II means failing to reject a false null. Failing to reject does not prove no effect. Statistical significance does not measure effect size.
WORKED EXAMPLE 1
Q. 15 of 30 Statistics students also take Linear Algebra. Find P(Linear Algebra | Statistics).
Answer. 0.50. Restrict to the 30 Statistics students: 15/30 = 0.50. The full campus is not the denominator.
Variation. If 10 of 50 take both, given Statistics: 10/50 = 0.20. Same rule, different group size.
WORKED EXAMPLE 2
Q. A fair coin is tossed 10 independent times. Find the mean and variance of the number of heads.
Answer. Mean 5; variance 2.5. Here n=10, p=0.5, so np=5 and np(1−p)=2.5.
Variation. For 20 trials with p=0.2: mean 4, variance 3.2. Use 20×0.2×0.8 for the variance.
WORKED EXAMPLE 3
Q. A test has 90% sensitivity, 5% false positives, and 1% prevalence. After a positive result, what is P(disease)?
Answer. 15.4%. Use 0.009 / (0.009 + 0.0495). Most people are healthy, so false positives matter.
Variation. At 2% prevalence, the result is 0.018 / 0.067 = 26.9%.
WORKED EXAMPLE 4
Q. For independent normal observations, n=25, mean=20, s=5. Use t*=2.064 for a 95% mean interval.
Answer. [17.94, 22.06]. SE=5/√25=1, so take 20 ± 2.064.
Variation. With n=100 and the same s, SE falls to 0.5. Recompute the critical value for a new interval.
CHOOSE THE METHOD Choose the model first: a count of independent successes suggests binomial; a sample mean needs a standard error. Report units and the population you are describing.
For P(A | B), divide by P(B). First name the group that is already known.
A larger n reduces the standard error, not the spread of individual observations.
State the model assumptions and units. A small p-value does not measure effect size.